Climate change
| Site: | Spark: piattaforma di e-learning del Liceo Majorana |
| Course: | eHAND: Effects of Human Activities on Natural Disasters |
| Book: | Climate change |
| Printed by: | Utente ospite |
| Date: | Tuesday, 28 July 2026, 2:32 AM |
Description
In this section you can find resouces, lesson plans, video about climate change and its conseguences, such as global warming, glaciers melting, extreme events, biodiversity loss..
Lesson plans
1. EARTH’S CLIMATE
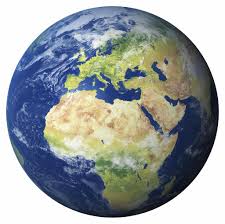
But what is the climate?
Lessons on the Earth climate.
2. Global warming
Scientific evidence for warming of the climate system is unequivocal.
Over the past 50 years, the average global temperature has increased at the fastest rate in recorded history.
Lessons on global warming
3. Warming oceans and Sea level rise
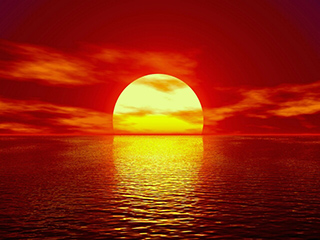
The seas of the Earth are rising, a direct result of a changing climate. Ocean temperatures are increasing, leading to ocean expansion. An armada of increasingly sophisticated instruments, deployed across the oceans, on polar ice and in orbit, reveals significant changes among globally interlocking factors that are driving sea levels higher.
4. Glacial retreat and Declining Artic sea ice
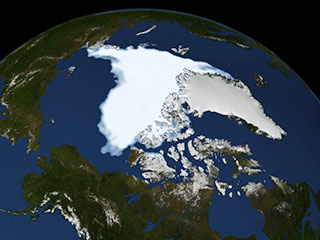 Glaciers are retreating almost everywhere around the world — including in the Alps, Himalayas, Andes, Rockies, Alaska and Africa.
The Greenland and Antarctic ice sheets have decreased in mass.
Both the extent and thickness of Arctic sea ice has declined rapidly over the last several decades.
Lessons
5. Biodiversity loss
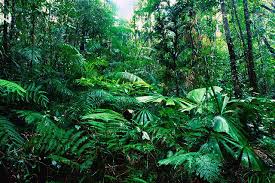
Human activity has been causing massive extinctions
Current extinction rates are up to 100 times
greater than natural, background extinction rates, because of the effect
of humans on other organisms and ecosystems. We impact the world around
us in many ways, some of which are more destructive than others.
6. Extreme events
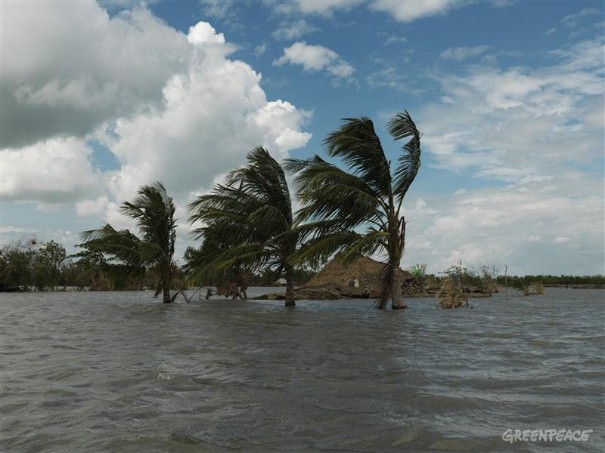
Some extreme weather and climate events have increased in recent decades, and new and stronger evidence confirms that some of these increases are related to human activities.
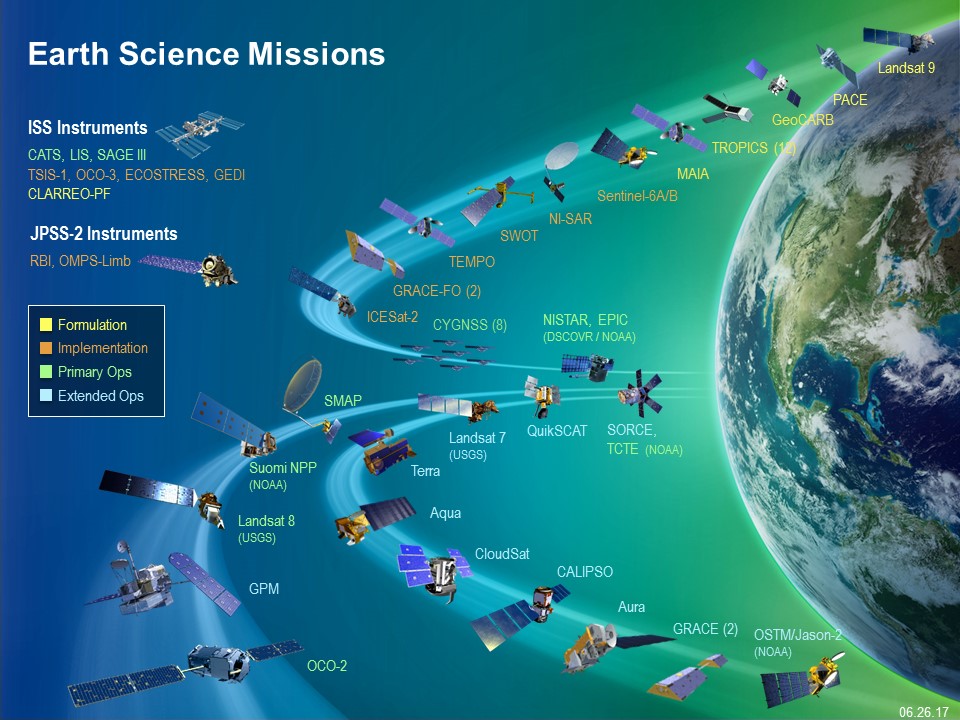
7. Earth monitoring
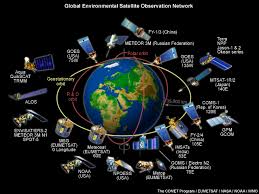
The Earth monitoring missions are designed to improve our understanding of Earth. They use cutting-edge space technologies to learn more about the interactions between the atmosphere, biosphere, hydrosphere, cryosphere and Earth’s interior, essential how Earth works as a system.
1. Earth Climate
LESSON: Habitable zone
Goals
-understand the qualitative correlation between the distance of a planet to a star and the energy density that impacts the planet.
- understand the energy budget on the Earth
Subject
Earth Science, Physics
Students age
14-18 y
Description
Activity1 (1 h)
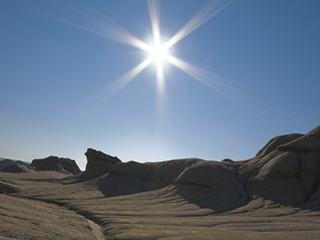
The key element that provides energy for chemical and biological processes on Earth is the Sun. How much of this energy is actually incorporated into the climatic system of the Earth depends on parameters like the intrinsic energy output of the Sun, its distance from the Earth as well as terrestrial properties such as the albedo and composition of the surface and the atmosphere.
A term that generally provides a first indication of a potential habitability of any planet is the habitable zone.
This is the range in a planetary system within which water can exist in its liquid form
Lab. activity1 Space Awarness resources
Activity2 (1 h)
Solar irradiation, the energy density of the solar radiation that hits the Earth, changes with solar activity cycles and annual modulation caused by the eccentric orbit of the Earth around the Sun. The accepted annual mean value is E = 1368 W/m2 as determined by satellite measurements. Averaged over the entire Earth’s surface area, the mean energy input is approximately 340 W/m2 To know more: NASA site
These are the quantities that govern the weatherand climate. While weather is understood to be an atmospheric phenomenon that changes on short time scales (temperature, pressure and precipitation), climate is the long-term (~30 years) average of these processes. If absorption and emission equilibria are assumed, the equilibrium temperature can be determined, which for the Earth on a global scale, is approximately 14°C. Without the atmosphere, it would actually be much colder. Calculus
Lab. activity2 S.A.resources
Activity3 (2 h)
In addition to temporal changes, we also experience spatial variations in climatic conditions, in areas known as climate zones. These areas are generally aligned with the latitudes, as the incident angle of solar irradiation changes from the equator to the poles.
Lab. activity3 S.A resources1
LESSON : Volcanic gases and climate change
Weather and climate
LESSON: monitoring weather and climate
Goals
- Learn how weather predictions are made, and the importance of data collection
Understand how to detect inputs from sensors
-
Learn how to process data received from sensors
-
Be part of a larger effort to gain a holistic understanding of global environmental issues
-
Understand the difference between weather and climate
Subject
Earth Science, Physics
Students age
14-18 y
Description
Activity1 (1 h): weather and climate
The weather is important to our daily lives, so let’s see how it works.Video
Read this article and watch this video
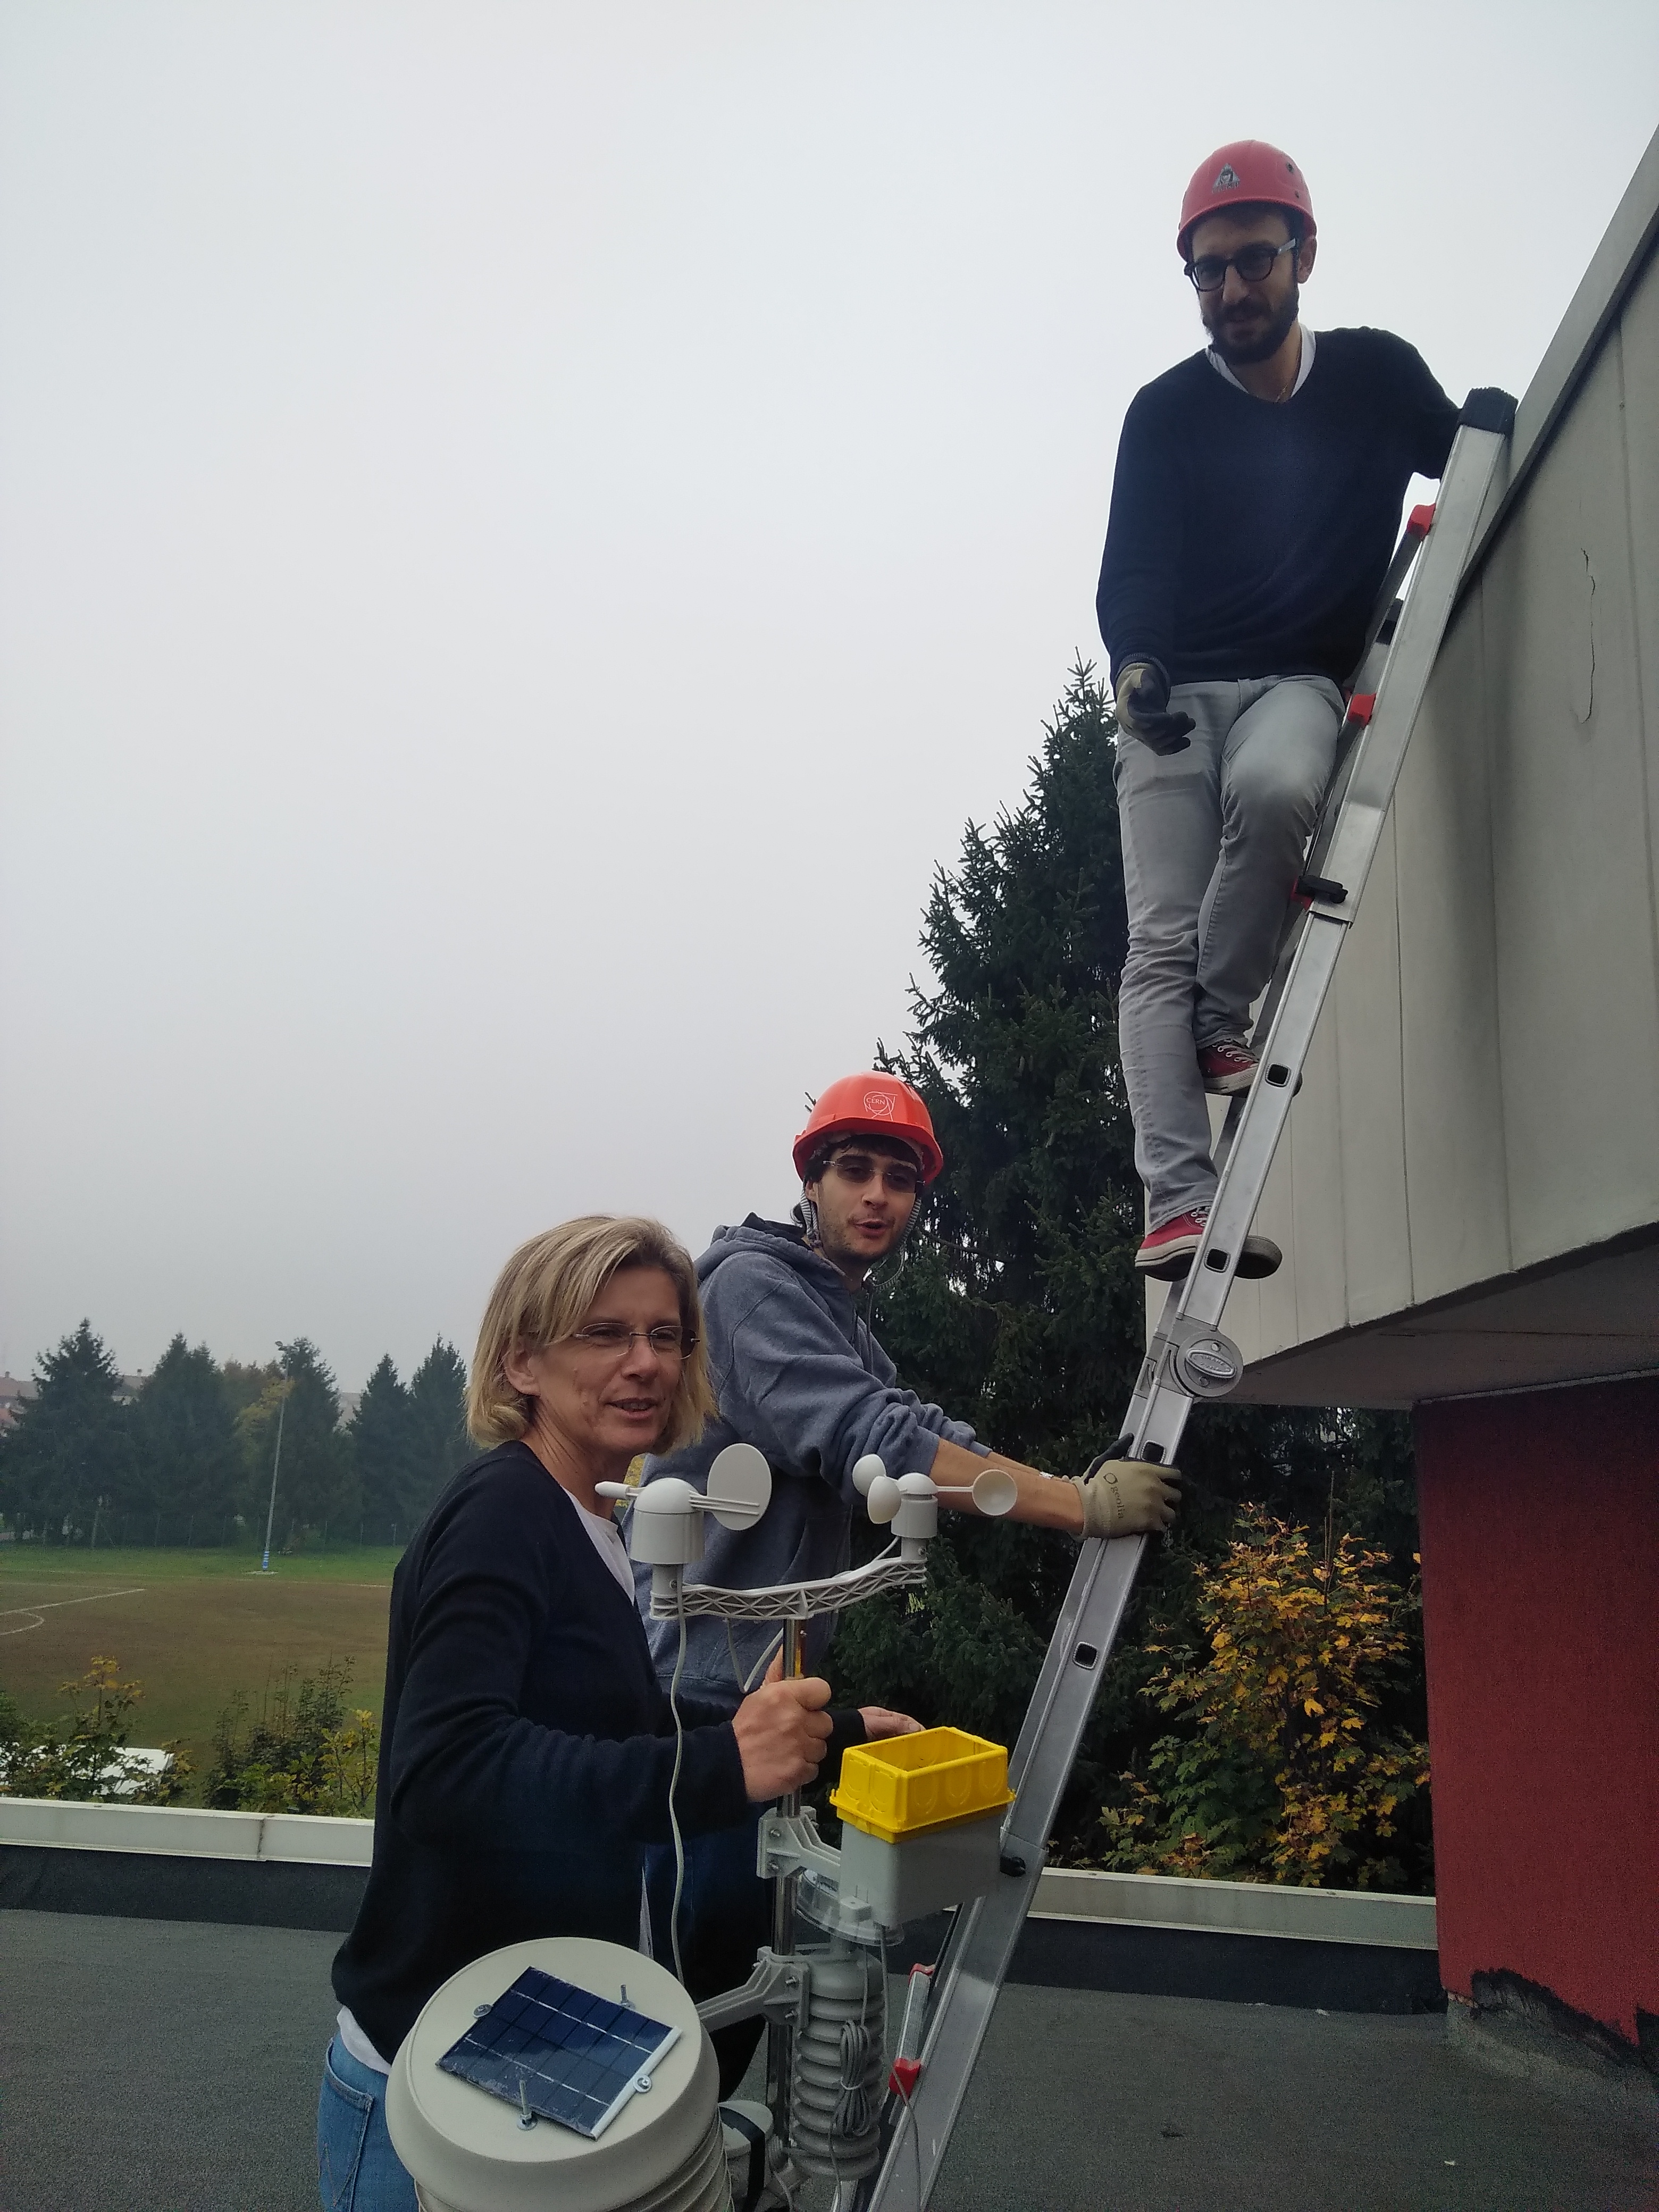
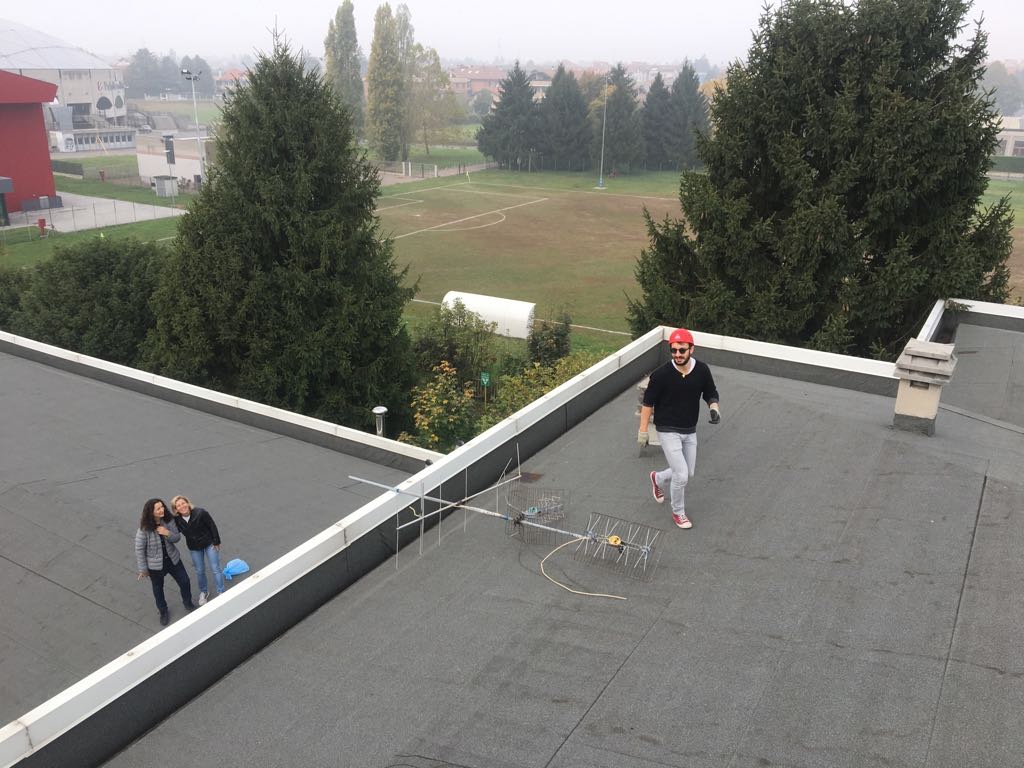
Activity2 (3 h): make your own weather station
You can skip this part and use data from meteo net, like meteorete in Italy, Metoffice or ESA Earth online.
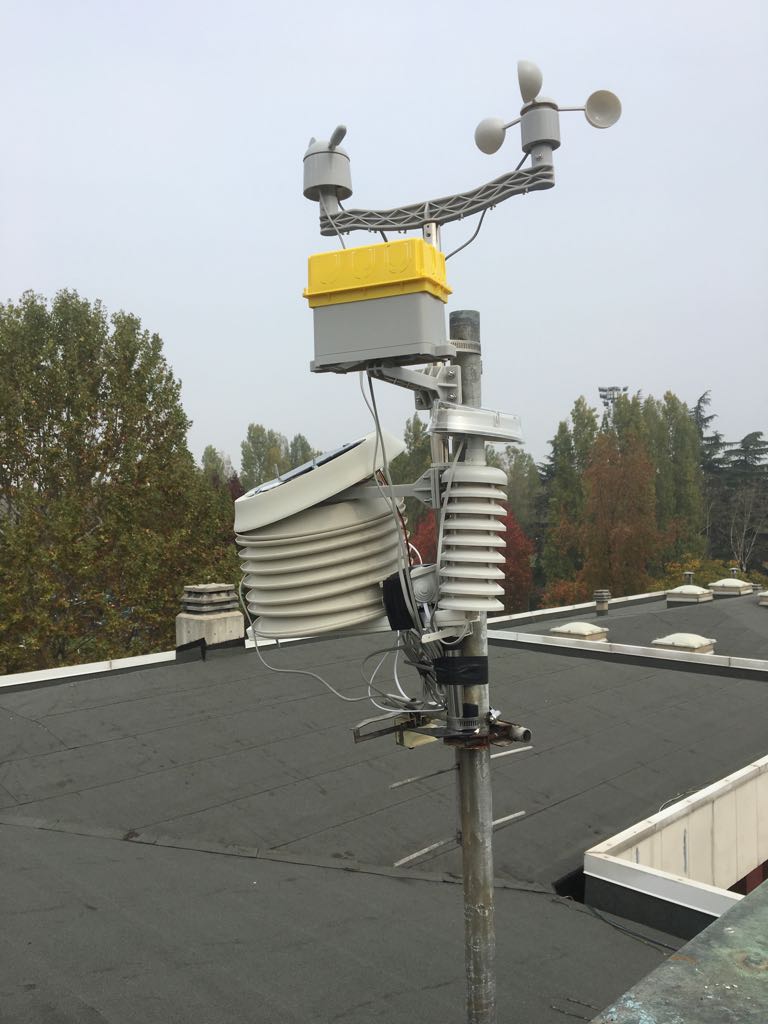
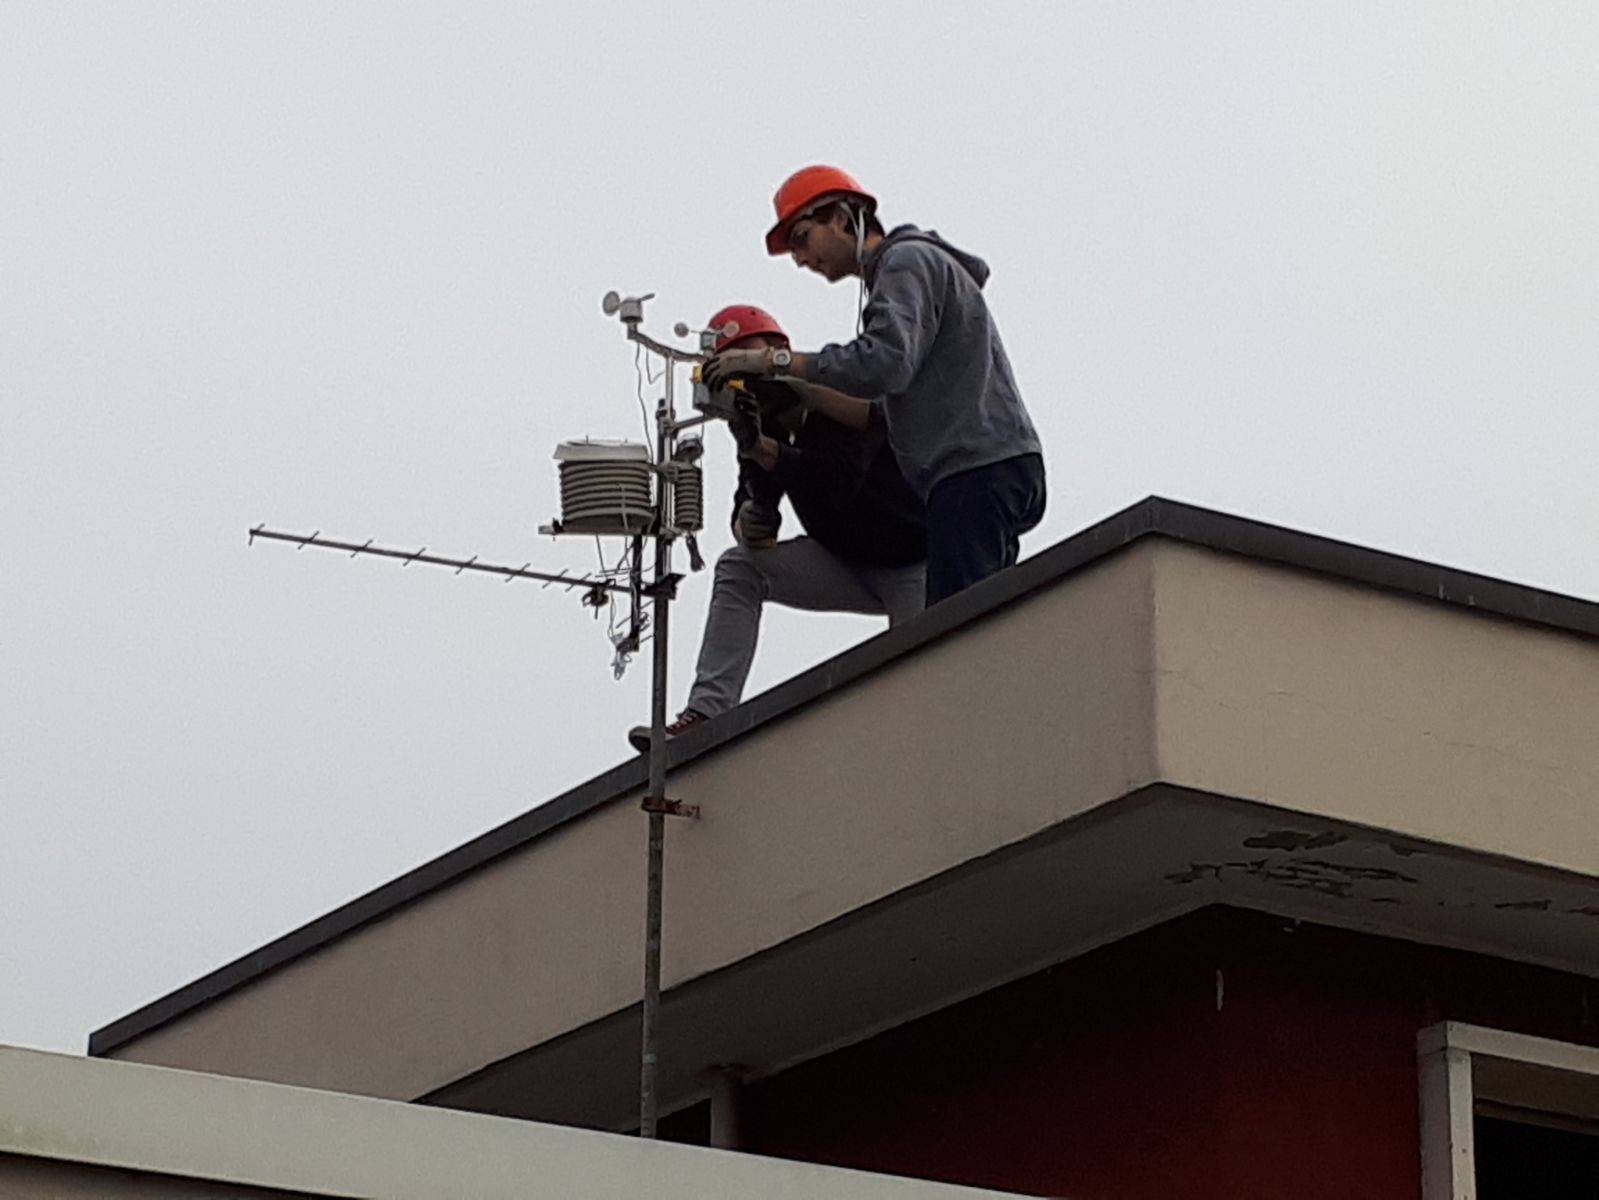
We built our weather station using the kit Pce fws 20 (PCE ITALIA)
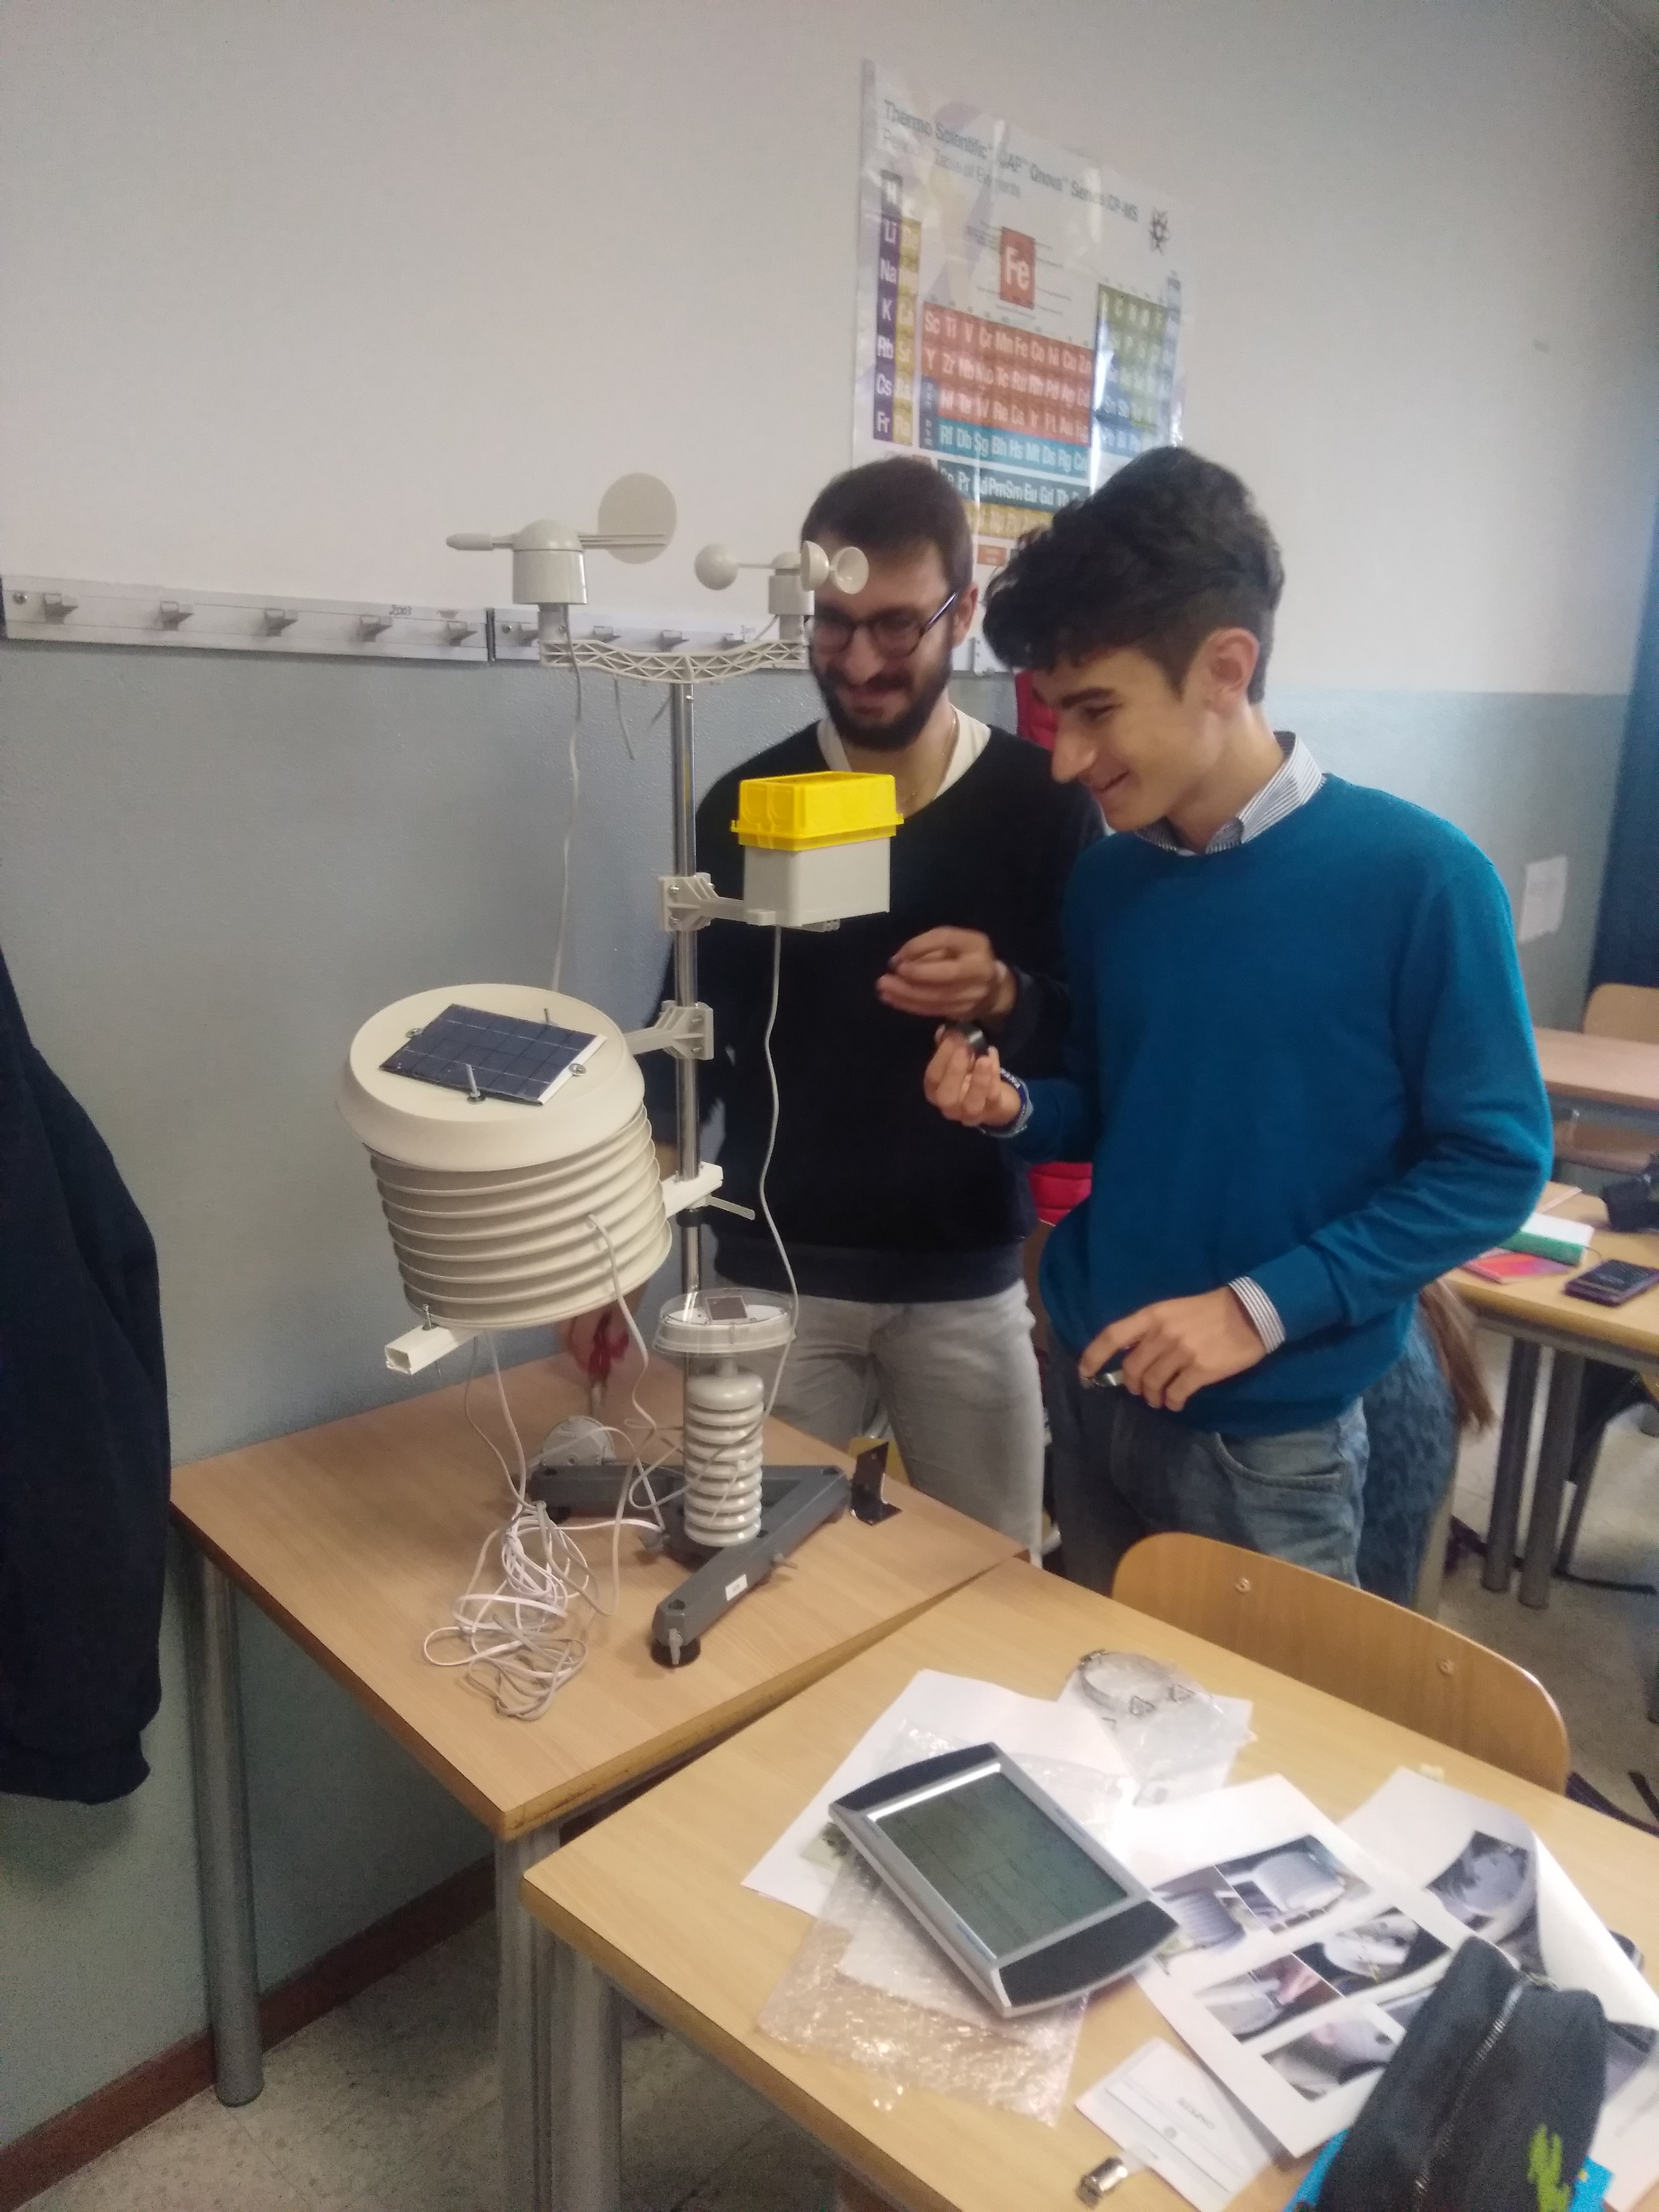
Students were asked to examine the sensors and we had lessons about the rain gauge, the wind vane. the anemometer, the ambient temperature and the relative humidity of the air sensor, the barometric pressure sensor.
 |
 |
|---|---|
 |
 |
Activity3: monitoring the weather
Students have to analyze the data every week and send their value to the International monitoring system in EduArctic,4.Glacial retreat and Declining sea ice
LESSON1
Goals
-understand the ice melting physics,-understand causes and effects of ice melting
-understand the impact from melting ice in the sea and on land
-understand in principle the difference between the structure of the Arctic and Antarctic
Subject
Earth Science, PhysicsStudents age
14-18 y
Description
Activity1 (1h) : Introduction to the problem ( pictures and graphs about the glaciers disappereance). Presentation about causes of melting. Focus on the methods of Heat Transfer . The Albedo problem. EssayLab. activity1 Experiments
Activity2 (1h) : Glaciers and Icebergs melting on the sea level rise. The Big meltdown
Lab. activity2 Experiments
LESSON2 Land ice vs sea ice
Based on Classroom activity NASALesson plan Whorksheet
2. Global warming
Lesson: Greenhouse effect
Goals
-understand the effects of an atmosphere on the surface temperature of a planet by driving a natural Greenhouse Effect
Subject
Earth Science, Physics
Students age
14-18 y
Description
Activity1 (1h) : Introduction to the problem
Over the past 50 years, the average
global temperature has increased at the fastest rate in recorded
history. And experts see the trend is accelerating: 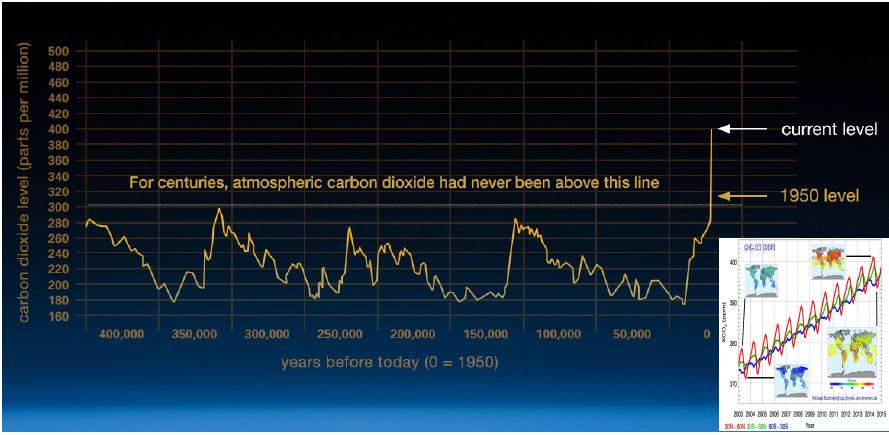
lab. activity1 SA resorces
Activity2 (2 h) Causes
lab. activity2 SA resources
ESA resources (students aged 14-16)
ESA resources (students aged 16-18)
Carbon Cycle (students aged 14-16)
Lesson: Ozone
3. Ocean warming
LESSON1- global warming and ocean
Goals
-understand how rising water temperatures influences sea levels-understand how oceans store heat
-understand how ocean currents can be affected by global warming
Subject
Earth Science, PhysicsStudents age
14-18 y
Description
Activity1 (1h) :The ocean covers 70% of Earth's surface and plays a starring role in whatever happens with
the environment. One big part of its role is to soak up energy (heat) and distribute it more
evenly around the Earth. Another part is to soak up CO2.
Students are asked if our ocean affects the climate and how.
After research and experiments the conclusion is
-Way up north, cold water in the North Atlantic ocean sinks very deep and spreads out all around
the world. The sinking water is replaced by warm water near the surface that moves to the north.
-The amount of salt in the ocean water also affects currents. Saltier water is heavier than less salty
water.
Our ocean absorbs more than 90% of the heat trapped by human-produced greenhouse gases. This extra-heat causes the sea leavel to rise, because of the thermal expansion and because the extra heat causes the melting of ice sheets and glaciers on land. ( see melting glacier experiment here)
Lab.activity2 Heat experiment
S.A. resources
Activity3 (2h) :
Global average sea level has risen nearly 20 cm over the past 100 years.
The rate in the last two decades, however, is nearly double that of the last century (3.4mm per year
Since the beginning of the Industrial Revolution,the extra-heat generated an increase of about 0,1°C of the ocean temperature
Lab.activity3 S.A. resources
Conseguences :
Extreme events
Declining ice sheet Essay
Biodiversity loss
Coral bleaching
LESSON2- graphing sea level trends with NASA Data
Based on Classroom activity from www.jpl.nasa.gov/edu/teach/activity/graphing-sea-level-trends/
LESSON3- Highways of the oceans
5. Biodiversity loss
Goals
-understand how biodiversity is defined,-learn why biodiversity is important,
-understand the methods used by science to measure biodiversity
-understand that each habitat (school garden) has a variety of plants,
-understand that each species is defined by its own unique characteristics,
-learn that biodiversity is an cimportant characteristic of a habitat.
Subject
BiologyStudents age
14-18 yDescription
Activity1 (1h) :
General introduction to biodiversity (key words).
-Students learn to measure the richness and abundance of a model ecosystem (can of beans)
-Students learn to graph data for model ecosystems and the histograms will be used for the
poster.
-Students learn to calculate a value that represents diversity (Simpson’s diversity index).
- Students learn to use findings to answer questions about model ecosystems.
-Students take some photos of their model ecosystem for the poster.
Lab.activity1 Bean biodiversity
Activity2 (1h) :
to identify and count the school garden tall trees to measure biodiversity
- General introduction to taxonomy.
-Students learn to identify the different tall tree species present in the school garden.
- Students take some photos of the tall trees for the poster.
-Students count the number of the different species to measure the richness and abundance.
-Students graph data for school garden ecosystem and the histograms will be used for the
poster.
-Students calculate Simpson’s diversity index for school garden ecosystem.
Lab.activity2 Simpson index
6. Extreme events
STORM and CYCLONES
Goals
-understand the cloud physics-understand the cyclones formations
-understand the Coriolis effect
-understand the differences between hurricanes and tornados
Subject
Earth Science, PhysicsStudents age
14-18 yDescription
Activity1 (1h) :
Some pictures of differents cloud are shown or taken by students in an outdoor activity; their very specific shapes are determined by different physical processes in the atmosphere. We want to explain some of these processes and how clouds work, based on current knowledge in the fields of Meteorology and Physics. Website
Students can also contribute to NASA’s studies of our home planet using the new “GLOBE Observer” app.
Lab. activity1 Cloud chamber
Activity2: Research - What Are Hurricanes?
Hurricanes, cyclones, and typhoons are all the same weather phenomenon; we just use different names for these storms in different places. In the Atlantic and Northeast Pacific, the term “hurricane” is used. The same type of disturbance in the Northwest Pacific is called a “typhoon” and “cyclones” occur in the South Pacific and IndianOcean. But there are differences between a tornado and a cyclone. Essay
Lab.Activity 2 Experiments
Lab.Activity 2b After the Storm (ESA materials)
Activity3: CORIOLIS EFFECT
The Coriolis Effect is an apparent force that makes things (like planes or currents of air) traveling
long distances around the Earth appear to move at a curve as opposed to a straight line.
The Coriolis effect also works on the circulation of atmospheric air. In the northern hemisphere, air-
pressure differences (the so-called pressure gradient) and the Coriolis effect mean that winds move
in a clockwise direction around low- pressure centres (cyclonic flow) and in a clockwise direction
around high-pressure centres (anticyclonic flow). The situation is the exact opposite in the southern
Lab.Activity 3 Experiments (previous video)
Quiz ( ref. S.A)
If you would like to share knowledge about unusual animal, environment, and weather events,
join LeoNetwork
LESSON PLAN: AFTER THE STORM
Tracking Hurricane Matthew and analysing its impact ESA resources
7. Earth monitoring
Earth monitoring - students level K10-12
Goals
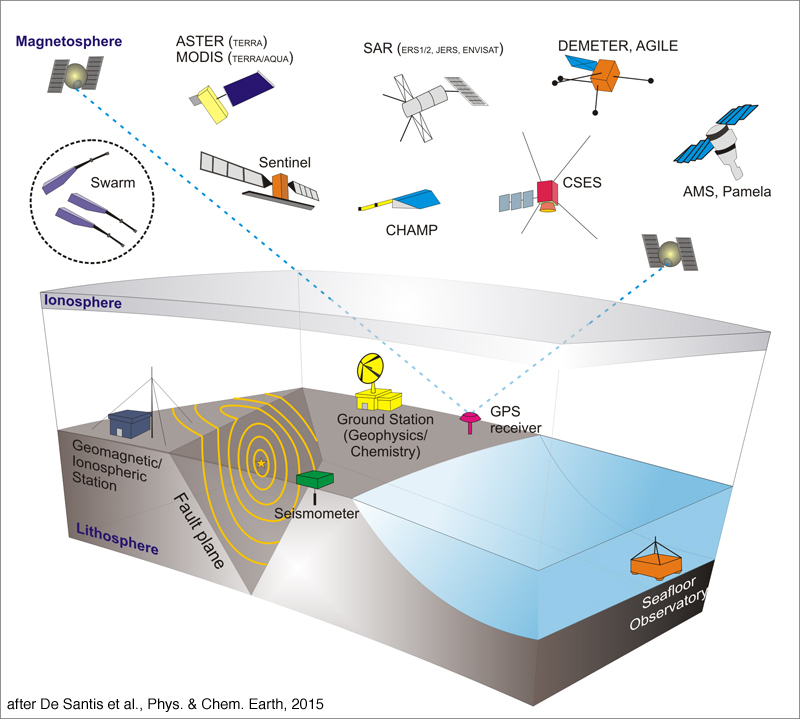
- learn how our planet is constantly monitored by integrated systems which collecte and integrate data from satellite, aircraft, and ground or underground sensors .- learn how satellite images obtained at different wavelengths help to identify Earth surface features
-learn basic analytical procedures and apply them to imagery data
-know the cutting-edge space technologies to learn more about the interactions between the atmosphere, biosphere, hydrosphere, cryosphere and Earth’s interior
Subject
Earth Science, Physics
Students age
16-18 y
Description
Activity1:
Our planet is changing on all spatial and temporal scales and studying the Earth as a complex system is essential in understanding the causes and consequences of climate change and other global environmental concerns. The purpose of Earth Science Research and Analysis Program is to advance our scientific understanding of Earth as a system and its response to natural and human-induced changes and to improve our ability to predict climate, weather, and natural hazards. These components involve multiple, complex, and coupled processes that occur on a continuum of spatial and temporal scales and affect climate, air quality, water resources, biodiversity, and other features that allow our Earth to sustain life and society.The Earth monitoring missions are designed to improve our understanding of Earth and use cutting-edge space technologies to learn more about the interactions between the atmosphere, biosphere, hydrosphere, cryosphere. These integrated systems collecte and integrate data from satellite, aircraft, and ground or underground sensors and are part of international collaboration, like
the NASA
missions such as the Terrestrial
Observation and Prediction System (TOPS)
 or
or
the ESA mission
such as Copernicus
Lab. Activity1 A view from above
Lab. Activity 2 Read the document
Download your images from Copernicus Open Access Hub
Analyze them using Sentinel Application Platform (SNAP)
Earth monitoring - students level K 8 -10
Goals
- learn how our planet is constantly monitored by integrated systems which collecte and integrate data from satellite, aircraft, and ground or underground sensors .- learn how satellite images obtained at different wavelengths help to identify Earth surface features
-learn basic analytical procedures and apply them to imagery data
Subject
Earth Science, Physics
Students age
14-16 y
Description
Activity1:
Students should define a climate problem that they would like to investigate, based on questions that arise from
their school studies and from observations in their local environment.
Students will have to plan their investigation of the problem,
including data collection and, if applicable, data comparison from
different sources. Then they should propose possible actions to help reduce the identified climate problem
Activity2:
https://apps.sentinel-hub.com/